From Stats to Suggestions: Adding Machine Learning to StravaDataAnalysis
Back in April, I rewrote my Strava analysis tool to be faster, more modular, and, crucially, ready to evolve. I wanted it to do more than just summarise what I’d already done. This update is the first step forward.
StravaDataAnalysis now includes its own built-in coach. Sort of.
I’ve added three machine learning pipelines:
- Weekly pace forecasting
- Automatic run classification
- Personalised training plan suggestions
And no, it doesn’t try to sell you protein powder or shout motivational slogans. Although I did briefly consider adding a pop-up that says “no pain, no gain” every time the forecast dips…
1. Forecasting Pace with Ridge Regression
This model’s job is simple: take my recent training data and answer the question, “How fast am I likely to run next week?”
It doesn’t need to be laser-accurate. It’s more about spotting trends. Am I speeding up? Slowing down? About to plateau?
The model uses:
- Weekly median pace
- Short-term averages and variability
- Number of recorded splits
These features get passed into a Ridge regression model, chosen because it handles multicollinearity well and doesn’t wildly overfit tiny changes. I train it using time series cross validation to avoid leaking future data into the past.
Here’s what the prediction looks like in practice:
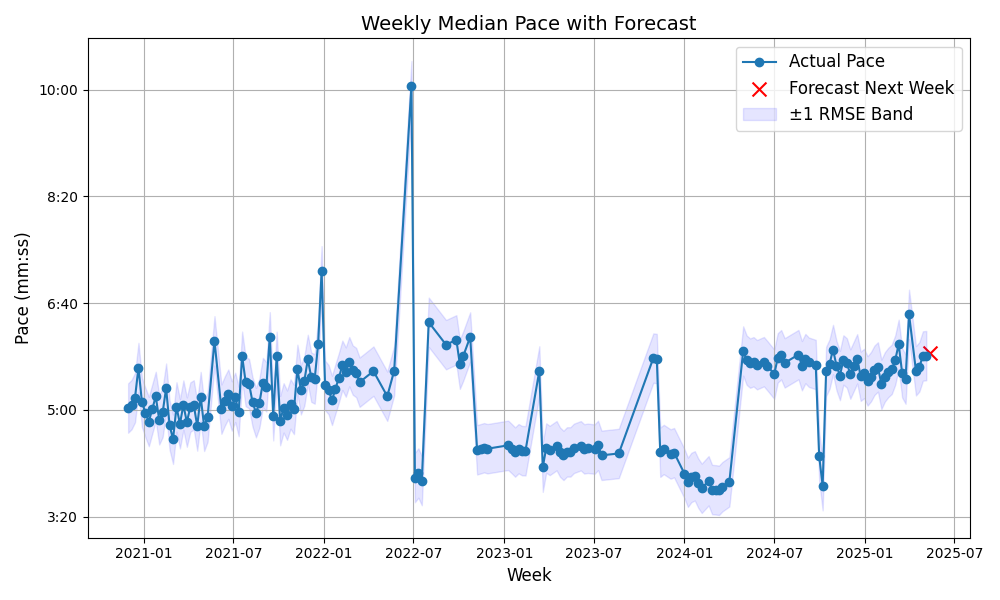
The red X is the forecasted pace for next week. The blue shaded area is a ±1 RMSE band, based on recent residuals from the model.
Why This Model?
I didn’t want anything fancy. Pace forecasting isn’t a competition grade problem, I just needed a model that:
- Handles small datasets
- Can spot simple upward/downward trends
- Doesn’t explode when I go on holiday for a week
Ridge regression ticked all the boxes.
What It’s Actually Useful For
- Catching slow slides: If my pace is trending down without me realising, this picks it up early.
- Spotting sharp jumps: After a block of speedwork, the model will often jump by 10–15 seconds/km.
- Adjusting expectations: If the forecast is slower than I hoped, it’s usually right… and I should probably back off.
A few times it’s been oddly spot-on. Other times, it’s reminded me that running on three hours of sleep isn’t conducive to progress. Either way, it beats going in blind.
What It Doesn’t Do
- It doesn’t know about race goals
- It doesn’t handle missing data very elegantly
- It doesn’t take into account terrain or weather (yet)
For now, it’s good enough to help me spot when I’m building fitness… or gradually falling apart.
2. Clustering Run Types
This one’s still a work in progress.
The goal is to automatically classify runs into types like Easy, Tempo, Intervals, or Long without manually tagging each session. In theory, unsupervised clustering should be perfect for this.
In practice? It’s… getting there.
What It Looks At
For each run, I aggregate the 1km splits and extract:
- Total distance
- Median pace
- Pace variability (standard deviation)
- Number of valid splits
- Day of the week and month (to spot patterns like Sunday long runs)
After clustering, I try to map each cluster to a label (Tempo, Long, Intervals, Easy), based on its characteristics. This mapping is manual and very fuzzy right now. Here’s the result:
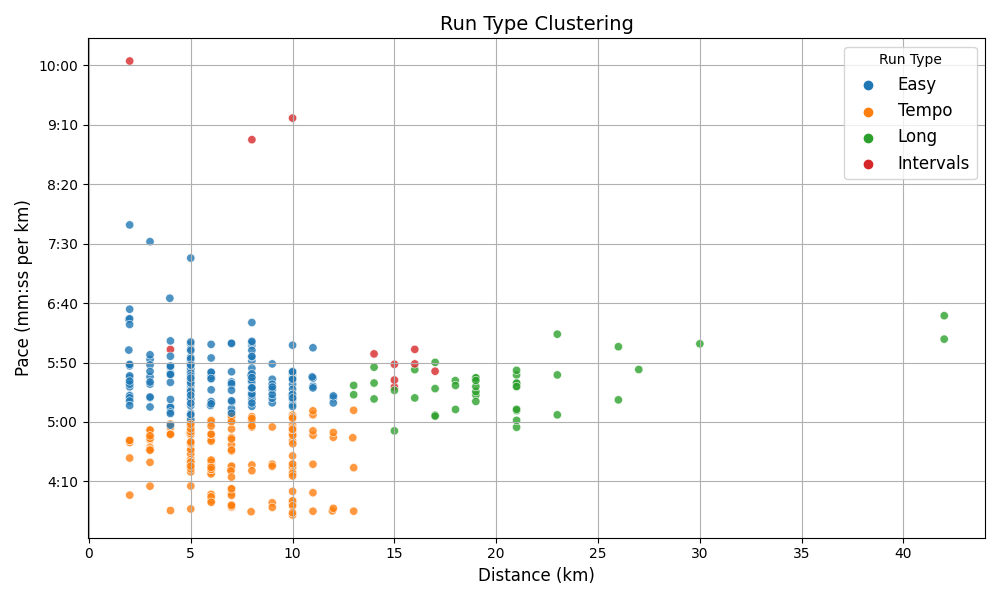
Once clustered, each group gets mapped to a run type. This part needs refinement.
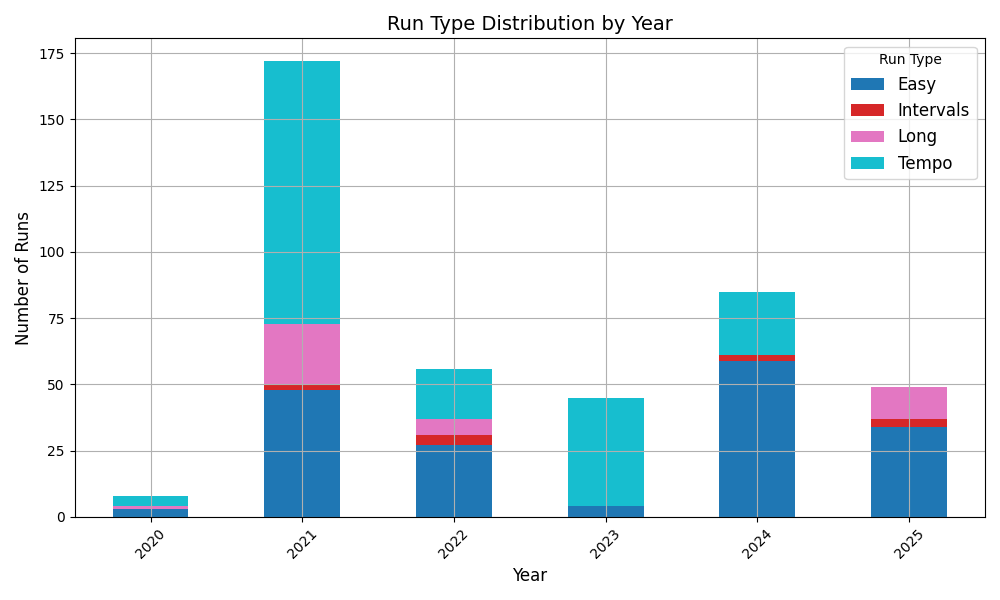
Over time, I can also track how my mix shifts:
What’s Good
- No tagging needed: I don’t have to label every run manually, which I was never going to do anyway.
- It’s directional: I can still see if I’m overdoing one kind of session.
- Trends over time: Even if the labels aren’t perfect, they’re consistent enough to show patterns.
What’s Not Working Yet
- Misclassifications.
- Lack of structure.
Honestly, I think I need to separate structured workouts from blob-shaped runs before this gets much better. Right now, KMeans is trying to classify based on shape, not intent.
Where It Could Go
A few options for improving it:
- Add pace skewness: To detect progression runs more reliably
- Include time-based segments: e.g. average pace for first vs. last third
- Use DBSCAN or HDBSCAN: For density-based clustering that handles outliers better
- Move to semi-supervised: Start with auto-clusters, then fine-tune with manual labels
But even in its current imperfect form, it’s enough to nudge me toward variety, or at least make me wonder why everything I do is the same shade of “mildly uncomfortable”.
3. A.I. Training Advisor
This part is a bit more fun. After analysing my typical training days, gaps in recent session types, and current pace zones, the model generates a suggested training week.
It’s gentle, not prescriptive. Think of it as “Here’s what might make you fitter without breaking you.”
Suggestions might include:
- A tempo session to boost threshold
- A long run to rebuild aerobic base
- A recovery run after a hard week
- Or simply… rest
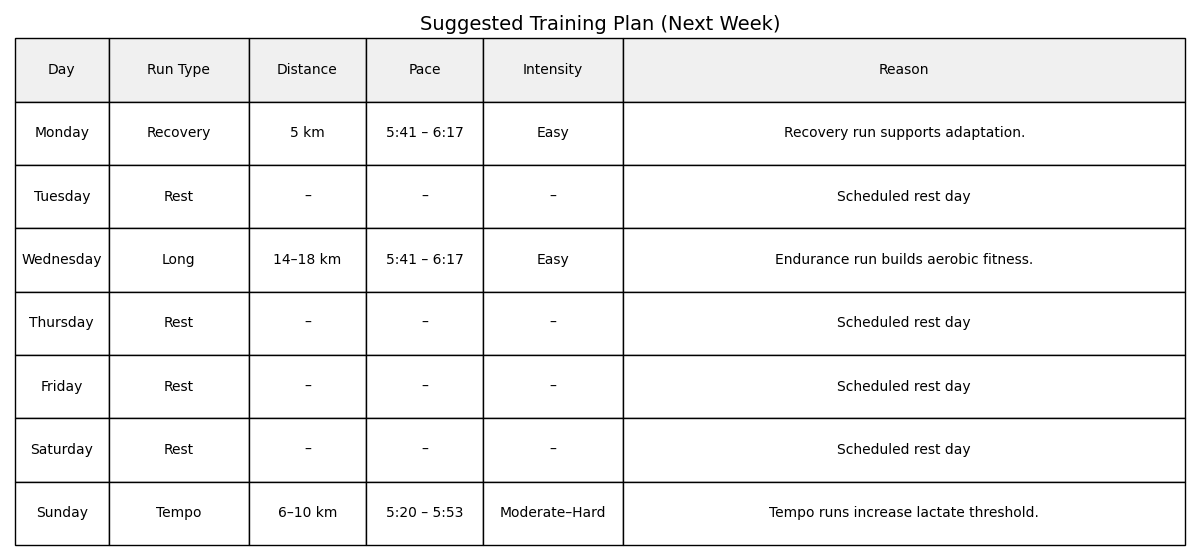
Here’s the result it gave me for next week:
Behind the Curtain
The advisor analyses:
- Your most frequent running days over the last 6 months
- Your training gaps over the past 8 weeks
- Recent paces (fast, median, slow)
- The number of sessions you probably meant to do
It then picks a sensible number of runs (usually 3 to 5) and tries to assign them to the days you’re most likely to stick to.
To avoid stacking two hard runs back-to-back, it treats “Recovery” and “Easy” as spacers, and gives everything else a bit of room to breathe.
What It’s Trying to Do
This isn’t some complex periodisation model with mesocycles and anaerobic thresholds. It’s much simpler:
- If you haven’t done any long runs lately, it’ll suggest one
- If you’ve skipped intervals, it’ll whisper “6x400m”
- If you’ve been flogging yourself for 10 days straight, it’ll politely say: “Have a nap”
It balances intensity and variety, and doesn’t assume you’re training for anything in particular. It just assumes that you’d like to run better and feel less broken.
Limitations and Future Tweaks
Right now, it’s based purely on your recent history (no heart rate, no terrain, no weather).
Things I’d like to experiment with next:
- Terrain-aware pacing: That “easy” run up Butser Hill says otherwise
- Cumulative fatigue scoring: Factor in the last 3–4 weeks of effort
- Burnout detection: Spotting declining cadence, increased variability, or general “meh”
- Goal-aware planning: Link it to a race date (if I ever decide to race again)
Seamless Integration
The best part? It’s all baked into the pipeline. I sync my latest runs, and everything kicks off:
- The pace model updates
- Run clustering refreshes
- A new plan gets built
No buttons, no fuss, just insights.
Dependencies like ‘scikit-learn’, ‘joblib’, etc. are handled via Poetry, and all outputs are PNGs for easy viewing.
What’s Next?
- Longer-term forecasting? Think: how far off a PB am I?
- Burnout detection? Is this just fatigue… or am I actually cooked?
- Linking terrain or weather into effort scoring? Was I slow, or were the hills mean?
Maybe.
For now, it’s just satisfying to see the project evolve from a stats dashboard into something that actually talks back.
No wrist based guilt tracking. No motivational quotes.
Just data, models, and the occasional gentle nudge to take a rest day.
GitHub repo → github.com/c-wilkinson/StravaDataAnalysis
Share on: